

Overview of the Market
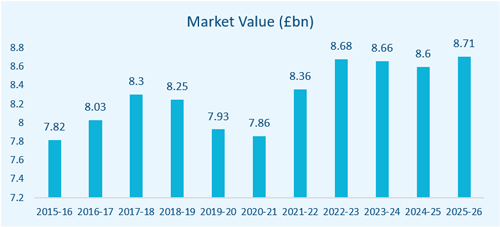
The UK Bread and Bakery Goods Production industry is estimated to be worth approximately £8.7bn with an annual growth rate of 0.9% between 2017 and 2022. Industry performance has been influenced by changing consumer trends, most notably rising levels of health consciousness, with consumers placing greater importance on their diets. Industry operators have fared well in responding to rising health concerns by focusing on expanding their product ranges to include healthier products.
Operators have also increasingly adapted their products to counter the offerings of artisan bakeries by launching more artisanal-style products. A surge in demand from supermarkets in the final two years of the period as a result of the COVID-19 (coronavirus) pandemic, is expected to support healthy revenue growth in the two years through 2021-22.
Over the next five years through 2026-27, industry revenue is forecast to decrease at a compound annual rate of 0.6% to £8.4 billion. Rising health consciousness is expected to continue to put pressure on sales of sugary products. However, as economic conditions become less uncertain following an expected recession in the current year, inflationary pressures are likely to ease. In addition, disposable incomes are expected to rise, making consumers more likely to spend more within the sector.

Market Share
The four major players in the market are as follows (Estimated):
- Warburtons Limited: 6.5%
- ABF Grain Products Ltd: 4.8%
- Hovis Ltd: 4.1%
- Finsbury Foods Group Plc: 3.8%
Operating Conditions
The industry displays a moderate level of capital intensity, with there being variances for certain segments. For example, a small craft bakery will have less capital investment needed and be more reliant on labour. The capital to labour ratio stands at approximately 1:4.92, meaning that for every £1 that is spent on capital, £4.92 is spent on labour costs.
The level of revenue volatility has remained at a medium level over the last five years. This has been underpinned by volatile inputs into the industry and changing consumer demand. High uncertainty surrounding future economic conditions caused consumer confidence to plummet, while inflationary pressures due to the weak pound has constrained disposable incomes.
Technological change is moving at a steady pace, with the largest players using the most technology. Large plants need many machines to streamline their manufacturing process and therefore invest heavily into this area.
M&A Activity in the Sector
Market IQ data indicates a total of 120 significant deals in the industry from January 2011 to November 2021, with UK targets. Deals are only reported over a certain value threshold (c.£500k), therefore, it is likely that not all deals have been captured.
Upon breaking down the deal type, M&A activity within the sector is mainly categorised by acquisitions, with 87 since January 2011. There were also 17 management buy-outs, 7 management buy-ins and a single merger. A geographical breakdown of the deals shows that the South East dominates M&A activity, benefitting from 17 deals in the time frame. Yorkshire and the North West were close behind with 15 and 14 deals being completed.
Deal flow has suffered a significant reduction to pre-recession levels. Deal levels fell drastically from 2011 to 2014 by over 50% due to post-recession effects. M&A activity since has been quite volatile, with the effects of the coronavirus pandemic stunting investment decisions. This is a sign of business confidence being at a low level as uncertainty about the future is high. The YTD figure for 2021 when forecasted to the end of the year, gives an estimated eight deals, showing that confidence is still low. Industry growth is expected to recover over the next five years, meaning that deal levels will likely increase over this period.
Industry Benchmarking Information – July 2021
Hallidays’ client base consists of small to lower mid-market enterprises. Our benchmarking analysis reflects businesses with turnover below £20m, in line with the majority of our clients in this sector.
| Bakery Product Benchmarking Data | Mean | Median | Lower Quartile | Upper Quartile |
| Turnover Growth/Decline (%) | 1.30 | 1.51 | (19.64) | (13.77) |
| EBIT Margin (%) | 1.30 | 2.70 | (2.03) | 6.56 |
| EBIT Growth/Decline (%) | 18.03 | 23.37 | (40.40) | 112.46 |
| EBITDA Margin (%) | 5.58 | 5.99 | 2.54 | 10.82 |
| EBITDA Growth/Decline (%) | 26.54 | 17.06 | (36.93) | 116.15 |
| Total Net Assets Growth/Decline (%) | (3.59) | 1.25 | (13.62) | 12.72 |
| Current Ratio | 1.95 | 1.48 | 0.83 | 2.88 |
| Acid Test | 1.55 | 1.13 | 0.70 | 2.10 |
Bakery Product Production Benchmarking
Using full company accounts filed in the last two years under the SIC-Codes “1071 – Manufacture of bread, fresh pastry goods and cakes.” or “1072 – Manufacture of rusks and biscuits, preserved pastry good and cakes”. Excluding companies with nil turnover in either period, we have summarised key benchmarking information for businesses under £20m turnover in the table above. July 2021.
M&A Activity Source
Experian Market IQ (November 2021)
Search Criteria: SIC-Code “1071 – Manufacture of bread, fresh pastry goods and cakes.” or “1072 – Manufacture of rusks and biscuits, preserved pastry good and cakes”.