

Overview of the Market
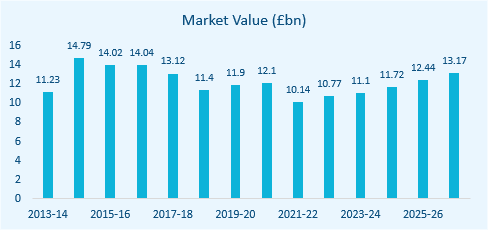
In the UK, the Tour Operator industry is estimated to be worth approximately £10.1bn, with a negative compound annual growth rate of (6.3)% from 2016 to 2021. The industry is expected to make an economic recovery, with an expected growth rate of 5.4% from 2021-26.
As a result of consumer confidence declining for the majority of the past five years, industry revenue has been limited, even decreasing over the first two years of the period. Falling confidence and the depreciation of the pound since the EU referendum have encouraged domestic tourism and weakened demand for overseas package holidays.
Following the financial crisis, households decreased heir holiday expenditure as disposable incomes dropped. The sector has since started to recover, however Brexit has had an adverse effect on revenue and diminished growth opportunities. In the current year, consumers have been unable to travel due to the outbreak of COVID-19, leading to an expected decline in revenue of 16.3% in 2020-21, with consumers continuing to hold off on committing to travel as the level of international coronavirus cases remains volatile.
Over the next five years, tour operators will be faced with the challenge of adjusting services and capacity to suit changing preferences. Industry demand is anticipated to be supported by UK holidaymakers resuming travel abroad once the threat of coronavirus is mitigated, therefore boosting industry revenue, which is forecast to grow at a compound annual rate of 5.4% over the five years through 2025-26 to £13.2 billion.
Operating Conditions
The industry has a high level of capital intensity, made up of low wages but medium capital costs. Using spending on wages as a proxy for labour costs and depreciation as a proxy for capital expenditure, it is estimated that for every £1.00 operators spend on capital, approximately £1.11 is spent on labour.
Industry revenue is expected to be highly volatile over the five years through 2020-21. Revenue trends over the period were influenced by economic uncertainty following the UK’s vote to leave the EU, with a fall in the current year also contributed to by the COVID-19 pandemic. Revenue is forecast to decline by 16.3% in 2020-21 as consumers remain reluctant to book tours during this period of uncertainty.
The industry does receive some level of assistance through government schemes such as the GREAT campaign to increase tourism in the UK. Also the government has recently provided £1.7 million in funding to People 1st to provide 500 apprenticeships in the tourism industry and to help create 15,000 jobs.

M&A Activity in the Sector
Market IQ data indicates a total of 77 significant deals in the industry from January 2011 to July 2021, with UK targets. Deals are only reported over a certain value threshold (c.£500k), therefore, it is likely that not all deals have been captured.
Upon breaking down the deal type, M&A activity within the sector is mainly categorised by acquisitions, with 55 since January 2011. There were also 10 MBOs, 6 secondary
buy-outs, 3 MBIs and 2 mergers. A geographical breakdown of the deals shows that London dominated M&A activity, benefitting from 17 deals in the time frame. The North West and the South East were close behind, with 16 and 14 deals being completed respectively. The rest of the deals are spread throughout other regions whilst slowly declining to the North East, with only one deal.
Deal flow has been growing with a gradual upwards trend through 2015-16, with a substantial dip in 2016, characteristic of the uncertainty effect that the UK’s exit from the EU brought about.
The COVID-19 pandemic led to a sharp decline in completed deals in 2020. This trend is expected to continue in the current year, as forecasting the YTD figure to the end of the year gives only 5 deals for 2021.
Industry Benchmarking Information – July 2021
Hallidays’ client base consists of small to lower mid-market enterprises. Our benchmarking analysis reflects businesses with turnover below £20m, in line with the majority of our clients in this sector.
| Tour Operator Benchmarking Data | Mean | Median | Lower Quartile | Upper Quartile |
|---|---|---|---|---|
| Turnover Growth/Decline (%) | (39.32) | (43.08) | (69.26) | (10.25) |
| EBIT Margin (%) | (4.99) | (2.76) | (28.83) | 3.65 |
| EBIT Growth/Decline (%) | (80.74) | (117.91) | (315.49) | (24.41) |
| EBITDA Margin (%) | (4.27) | (1.48) | (25.57) | 4.55 |
| EBITDA Growth/Decline (%) | (90.31) | (93.85) | (258.34) | (14.28) |
| Total Net Assets Growth/Decline (%) | (15.27) | (10.79) | (49.00) | 1.81 |
| Current Ratio | 2.87 | 1.38 | 1.09 | 2.05 |
| Acid Test | 2.87 | 1.38 | 1.09 | 1.97 |
Tour Operator Benchmarking
Using full company accounts filed in the last two years under the SIC-Code “7912 – Tour operator activities”. Excluding companies with nil turnover in either period, we have summarised key benchmarking information for businesses under £20m turnover in the table above. July 2021.
M&A Activity Source
Experian Market IQ (July 2021)
Search Criteria: SIC-Code “7912 – Tour operator activities”.